Decoding Hospital Stays: A Data Exploration of Time, Treatment, and Fairness
- rachelorrell
- Apr 9, 2025
- 3 min read

During my years as a healthcare worker, I followed up with countless patients who came and went from the hospital. Each story reminded me of the delicate balance between providing quality care and managing resources. It’s a dance that can be tricky, especially when trying to ensure fairness and equity for everyone involved. This reflection inspired me to explore a dataset of hospital stays, hoping to peel back the layers of patient experiences and uncover patterns that could improve care for all.
Why THIS Project?
The motivation for this project stems from my passion for patient care, developed over years of working in the healthcare sector. I wanted to ask a critical question: What influences how long patients stay in the hospital, and can we optimize care while ensuring everyone gets treated fairly? I felt a strong connection to this topic, believing that data can reveal valuable insights that help enhance both efficiency and equity in patient care.
What Readers Will Gain
By reading this article, you will learn about the factors affecting hospital stays, including the relationship between lab procedures and length of stay. You will also discover unexpected findings regarding treatment equity among patients of different races. The insights shared here could spark conversations on how hospitals might improve their practices.
Key Takeaways
Most patients are discharged in less than 7 days.
Racial differences in lab procedures ordered were not significant.
There’s a clear connection between lab procedures and length of hospital stays.
Thoracic Surgery has the highest average procedures per patient stay.
Dataset Details
The dataset I worked with covers ten years (1999-2008) of clinical care from 130 hospitals in the U.S., specifically for patients diagnosed with diabetes, and it comes from here. It consists of two tables: one for demographics, including race, gender, age, and weight, and another for health data, detailing time in the hospital, medical specialties, and procedures. The dataset includes 1,000 patients. This rich data was perfect for my analysis, as it provided a comprehensive look into various factors influencing hospital stays.
Analysis Process
The analysis involved several steps, starting with cleaning the data to ensure all information was in the right format. After that, I examined the relationships between different variables, such as race and the number of lab procedures ordered. To visualize my findings, I created a histogram and queries using SQL, which helped simplify complex data into understandable insights. One surprise was discovering that there were no significant differences in lab procedures ordered by race, challenging my initial assumptions about disparities in treatment.
Visuals and Insights
Histogram of Hospital Stays: This visual illustrates the number of patients based on their length of stay. It shows that the majority of patients were discharged in less than 7 days, which suggests that most cases were managed efficiently.

Do the majority of patients stay less than 7 days? 
Lab Procedures by Race: This query shows that lab procedures ordered were similar across different racial groups, indicating that there are no apparent disparities in treatment based on race.

Average lab procedures by race 
Average Time in Hospital by Lab Procedure Frequency: This visualization highlights the correlation between the number of lab procedures and the length of stay, reinforcing the idea that more procedures may lead to longer hospital stays.

Average time in hospital by lab procedure frequency 
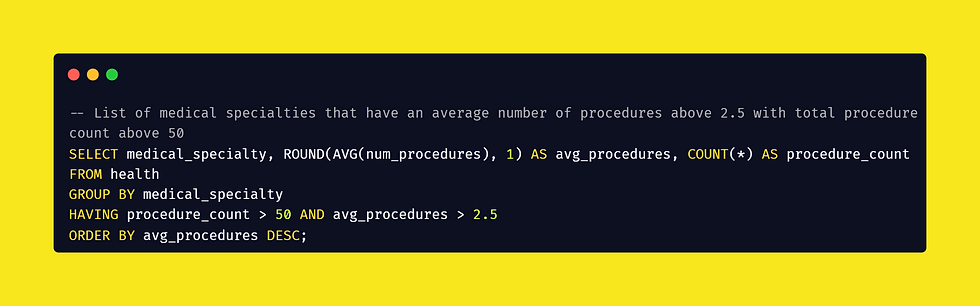
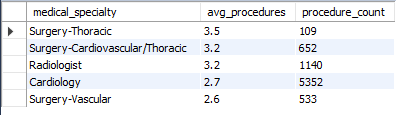
Medical Specialties with Average Procedure Count: This query lists specialties with higher average procedures, revealing that Thoracic Surgery is at the top, with an average of 3.5 procedures, emphasizing a more intensive care requirement for this specialty.
Main Takeaways
Hospitals should consider evaluating patients who stay longer than 7 days to determine whether their cases require more attention or if resources could be allocated more effectively.
Further investigations into potential racial disparities should be conducted, as this analysis didn’t reveal significant differences in lab procedures, nor were there significant differences in regular procedures (query not shown here).
It's also essential for hospitals to assess whether the growing number of lab procedures correlating with the length of stay is appropriate or needs adjustment.
Conclusion and Personal Reflections
Working on this project taught me a lot about the complexities of patient care and data analysis. I faced challenges in cleaning the dataset and ensuring accurate interpretations, but overcoming these hurdles was rewarding. This experience has reshaped my perspective on how data can inform better practices in healthcare. Moving forward, I hope to contribute further to the dialogue on optimizing patient care and ensuring fairness in treatment.
Call to Action
I’d love to hear your thoughts on this topic! Connect with me on LinkedIn, and feel free to leave a comment with your questions or insights.

Comments